News
What’s New in the Third Edition of Kingdoms of Life Connected? January 12 2023, 1 Comment
Last fall, I completed the third edition of my book, Kingdoms of Life Connected: A Teachers’ Guide to the Tree of Life. This came only six years after the second edition, which in turn came eight years after the first edition. “Why all this change?” you may ask.

I found that updates were needed because of changes in biologists’ view of the diversity of life. The data about how organisms are related continue to pour in, and because of this, the details of lineages and relationships change. You may be tempted to wait until the field stabilizes and stick with older ideas. Children, however, need a useful view of the diversity of life, even if it will be somewhat amended later. They cannot build on a foundation that is clearly obsolete. Specifically, it is no longer useful to present children with Five or Six Kingdoms, and those charts need to go in your history-of-science file.
I updated Kingdoms of Life Connected from cover to cover. I redid the lists of learning resources – books and websites; I purged links that no longer worked and added new ones. Publishers and authors have brought forth valuable new books in recent years, and I added titles to the lists while retaining older but useful books. I revised all the text, including the activities and lesson suggestions. I fact-checked the information to make sure it was as up to date as I could make it.
There is one especially important addition, a new lesson for introducing to the Tree of Life chart to beginning elementary children. This lesson gives older children important concepts as well, particularly if they have not yet had this overview. The introductory lesson leads children to the idea that all life shared a common ancestor and is connected. It shows them the relationships between the major branches of life. For example, they learn that the animals and fungi are sister lineages and that plants are only distantly related to fungi.
I’ll give a brief summary of some of the changes below. For more information, see the book, which is available at https://big-picture-science.myshopify.com/collections/biology/products/kingdoms-of-life-connected-third-edition (printed version). The ebook (pdf) is at https://big-picture-science.myshopify.com/collections/biology/products/kingdoms-of-life-connected-third-edition-ebook.
There are no big changes in the prokaryotes. I have kept a very basic approach because it takes extensive knowledge of biochemistry to understand the many branches of bacteria and archaea. Introductory college biology texts present a few basic lineages, and I felt that this approach would be good for children as well.
In the protists, I rearranged the Excavata lineage on the Tree of Life chart. Now, the euglenazoa and kinetoplastids are sister lineages and the metamonads are the first branch. I expect that Excavata will be split apart and redone in the future. It probably won’t be a eukaryotic supergroup, but studies continue to confirm the other supergroups – Archaeplastida, SAR, and Amorphea.
Scientific terminology evolves, and I was happy to see a complicated name go away. The branch of the stramenopiles and alveolates was previously called Chromalveolata, but that term has fallen out of favor. It originally described a lineage that included two branches I didn’t show, the cryptophytes and haptophytes; these are now placed elsewhere on the Tree of Life. The branch of the stramenopiles and alveolates may get a new name, but it seems best to leave that branch blank for now.
The fungi were the major branch that changed the most. The former Zygomycota lineage is now divided into two main lineages, the Mucoromycota and the Zoopagomycota. On my Tree of Life chart, I show the larger one, Murcoromycota. Its branches include the pin molds or Mucoromycotina (black bread mold, for example) and the arbuscular mycorrhiza fungi or Glomeromycotina (AM fungi). The AM fungi were previously placed on their own branch, but they have been added back to Mucoromycota. I didn’t add the Zoopagomycota to the Tree of Life chart, but if you have children who are interested in learning more, Fungarium by Katie Scott and Ester Gaya, is a good book for launching their explorations.
In the animal kingdom, studies have clarified some relationships in the protostome branch. You can give children the term “Spiralia” for the lineage previously called Lophotrochozoa. The whole branch is called Spiralia; “Lophotrochozoa” still refers to the mollusks and annelids. It is another of the situations where it is useful to know an older and newer term. “Lophotrochozoa” has been used for the Spiralia branch for about 20 years, and it appears in a number of websites. I recommend looking to the future and using “Spiralia” primarily. It is certainly easier to say and spell.
In the plant kingdom, studies have resolved several questions about the bryophytes. They are a single branch of life, a monophyletic lineage. The first branch was recently determined to be the hornworts. The mosses and liverworts are sister lineages. The older story was that the liverworts were the first branch because they do not have stomata. It appears that their ancestors lost their stomata rather than never having them.
The virus chapter now has suggestions for making a model of a coronavirus. I published this chapter as a stand-alone pdf in 2020. Note that if you have the third edition of Kingdoms of Life Connected, you already have the content of “What Is a Virus?”.
It is easy to become overwhelmed by all the names and branches of life. I recommend that you concentrate on the larger branches on the Tree of Life and continue to other branches as children (and you) learn about these and are interested in pursuing more. For in-depth studies at the elementary level, I recommend the digging further into the animal and plant kingdoms.
Start with the big overview of the Tree of Life. After that, my learning material, Sorting Branches on the Tree of Life: Vertebrates and Plants, is a good place to go. It is available as a pdf that you can print https://big-picture-science.myshopify.com/collections/biology/products/sorting-branches-on-the-tree-of-life-vertebrates-and-plants or as a printed material https://big-picture-science.myshopify.com/collections/biology/products/copy-of-sorting-branches-on-the-tree-of-life-vertebrates-and-plants-file-for-printing.

Enjoy your explorations of the Tree of Life!
Make Your Own Timeline of Life April 23 2021, 1 Comment
The Timeline of Life, with its starring role in the Coming of Life Great Lesson, is an important material for elementary Montessori classrooms. Teachers must either purchase one or make their own. The commercially available ones all have issues, which make some of them undesirable for the classroom. See my previous blog article, What goes on a Timeline of Life? for the details. That’s the bad news.
The good news is that making a Timeline of Life isn’t as difficult as it first appears. It is a timeline of the Phanerozoic Eon. Here are the measurements for a timeline that is three meters long. On it, 1 cm symbolizes 2 million years. The Phanerozoic Eon itself takes up about 2.71 meters. The extra length allows you to add the late Proterozoic Ediacaran biota and gives you a border at the ends of the chart.
|
Geologic time interval |
Start and end times (Ma= million years ago) |
Duration in millions of years |
Length on the timeline in centimeters |
|
Paleozoic Era |
541-252 Ma |
289 |
144.5 |
|
Cambrian Period |
541-485 Ma |
56 |
28 |
|
Ordovician Period |
485-444 Ma |
41 |
20.5 |
|
Silurian Period |
444-419 Ma |
25 |
12.5 |
|
Devonian Period |
419-359 Ma |
60 |
30 |
|
Carboniferous Period |
359-299 Ma |
60 |
30 |
|
Permian Period |
299-252 Ma |
47 |
23.5 |
|
Mesozoic Era |
252-66 Ma |
186 |
93 |
|
Triassic Period |
252-201 Ma |
51 |
25.5 |
|
Jurassic Period |
201-145 Ma |
56 |
28 |
|
Cretaceous Period |
145-66 Ma |
79 |
39.5 |
|
Cenozoic Era |
66 Ma-present |
66 |
33 |
|
Paleogene Period |
66-23 Ma |
43 |
21.5 |
|
Neogene Period |
23-2.6 Ma |
20.4 |
10.2 |
|
Quaternary Period |
2.6 Ma-present |
2.6 |
1.3 |
Timelines are much more than just a time scale. This one needs illustrations of life and how it has changed over time. I was happy to find that the United States Geological Survey (USGS) has a great source of these illustrations online. In 2020, a physical exhibit called “Trek Through Time” opened at the USGS headquarters in Reston, Virginia. That exhibit is also available online at https://www.usgs.gov/science-support/osqi/youth-education-science/trek-through-time. It is illustrated with posters for each time period. Here is an example, the poster for the Ordovician Period.

Click on the “Let’s Take a Walk” link to access the posters for the time periods. These high quality illustrations are in the US public domain, and you can print them for your classroom. Click on the thumbnail illustrations of each poster to get the files for printing. Select “original” to get the largest size, which can be printed on letter-sized paper. These posters have a small world map inset that shows the land masses at that time. A red dot marks the location that will become Reston, Virginia. The description of each time period has information about the biota of the Earth, how our planet looked, and what its climate was like. It also gives conditions in Virginia at that time. This information would make good text cards to go with the posters.
For the Ordovician and Silurian Periods, the poster is wider than the time period. For the Cenozoic, the six posters will have to be stacked one on top the other because each of them is about as wide as the whole era.
The Trek Through Time posters are a good start to a useable, up-to-date timeline of life. You can add organisms as the children explore prehistoric life. When children see a dynamic timeline develop as they add their own contributions, it can be more engaging than working with one that is all done for them. Adding new fossil discoveries can be especially inspiring.
If you have good illustrations of animals from an otherwise not-so-great timeline, you may be able to use them on your new timeline, but carefully read and verify any information on cards for the organisms and make sure that you place them in the correct time period. Wikipedia can be a great help in finding when an animal lived if you have a name it.
Illustrations of plants from older timelines are usually not worth keeping. There are good black-and-white drawings of ancient plants at the Virtual Paleobotany website, https://ucmp.berkeley.edu/IB181/VPL/Dir.html. You can also find illustrations in books on fossil plants and plant evolution, which you may be able to get from a library.
What about all those red lines that appeared on the original Montessori timelines? I recommend that you leave them off unless you can connect organisms in valid lineages. If you can’t stand back and see meaning and pattern in the lines, they are likely to distract rather than give a useful impression. Certainly, you should not have any lines that come together. The Tree of Life branches out.
Add the five mass extinctions by drawing a thicker black line after the Ordovician, Devonian, Permian, Triassic, and Cretaceous Periods. These events have been major factors in the shaping of life on Earth.
If you and your children are interested in learning more about mammals after the dinosaur extinction, my new material, The Story of Mammals: From the dawn of life to the present day, has instructions for making a Cenozoic timeline that is long enough to show the many changes in mammals in the last 66 million years. This set includes the file to print 84 picture cards to place on the timeline and a 76-page booklet of lessons. You can see it at https://big-picture-science.myshopify.com/products/the-story-of-mammals.
I hope that you and your children enjoy your explorations of life through time.
What goes on a timeline of life? November 05 2020, 5 Comments
Suggestions for evaluating a timeline of life.Spring cleaning in your biology closet March 04 2020, 0 Comments
It’s that time of year when the urge to put things in order can strike. You may have a closet with a lot of biology materials that you want to evaluate. Here are my suggestions for things to throw out. You may not want to discard the whole material just because it has flawed content provided it is feasible to fix the problems.
In the animal kingdom materials, if you find anything that has the phylum Coelenterata, please remove that name or cover it. Biologists haven’t used it for more than 30 years. That phylum was split into two others when biologists discovered that it held two unrelated groups. The two lineages are called phylum Cnidaria (anemones, corals, and jellyfish) and phylum Ctenophora (comb jellies). It is likely that you can cover over “Coelenterata” and add the label “Cnidaria.” Just make sure that you don’t have comb jellies in with your cnidarians.
Another no-no for the animal kingdom is showing protozoa along with the animals. This goes back to the two-kingdom idea of classification, and biologists and biology textbooks haven’t grouped protozoans with animals in more than 40 years.
If you find a chart that is labeled “Non-Chordates,” change the title to “Invertebrates.” Maybe “non-Chordate” was useful in the past, but biologists use “invertebrate” far more often. I searched books on Amazon.com using “non-chordates,” and I got six titles, all published outside the US. I searched “invertebrates,” and got over 6000 titles. A non-chordate chart isn’t likely to show current information, so it is time to recycle it or at least recycle the images and add new text.
The relationships between the phyla of animals solidified about 15 years ago. In biology, classification has morphed into systematics, which all about relationships and shared common ancestry. The details of this would take several blogs so I will simply say that the arthropods are related to the nematodes, and the mollusks are related to the annelids. Arthropods were once grouped with annelids, but that is no longer considered valid. Can you add something to your animal kingdom chart that shows which phyla are closely related? See my book, Kingdoms of Life Connected, for help if your animal kingdom chart needs a redo. https://big-picture-science.myshopify.com/collections/frontpage/products/kingdoms-of-life-connected-second-edition. It is also available as an ebook (pdf).
Dig back into the cobwebs in the botany section of your closet. If your chart of the plant has club mosses separated from the fern clade – whisk ferns, horsetails, and ferns – you have a good representation of life’s diversity. The chart from InPrint for Children is a good example. https://big-picture-science.myshopify.com/collections/montessori-botany-materials/products/plant-kingdom-chart . Another mark of a current material – it should use the term “eudicots” instead of “dicots.” If your chart has phylum names, it is quite possible that many of the names are obsolete. Many botanists no longer use phyla or division names. Instead, they use lineage names, and sometimes a common name is all you need. I have a graduate level botany textbook that uses no phylum/division names.

If your plant kingdom chart has fungi or bacteria on it, the time has come to do some serious pruning. Those two have to go to their own charts. If the image of a fungus appears on a plant kingdom chart, that’s what children will remember even if you say that it doesn’t belong there. The fungus kingdom is a sister to the animal kingdom. In nature, fungi and plants are partners, but on classification charts, they shouldn’t hang around together.
If you have a Five Kingdoms chart, file it under the history of biology. It should NOT be the first thing children see as they study the diversity of life. The Tree of Life is the place to start.
How about your timeline of life? This is a difficult material to do well, and there are many bad attempts out there. Does your timeline show several red lines coming together (converging)? That’s the traditional style, but lineages do not converge (fuse together); they diverge (split apart). Maybe you could salvage the images and redo the timeline without the misleading lines. Check the dates for the fossils because there are several in the wrong place on the older timelines.
Does your timeline of life have photos of extant animals or plants in prehistoric times? This gives a very wrong impression. I’ve seen a timeline that had “First marsupial” and a picture of a kangaroo. This is just like saying “First eutherian (placental) mammal” and showing a picture of a horse. Both the kangaroo and the horse evolved within the last few million years. They are both adapted to live on grasslands and open shrub lands, where resources are spread out, and there is little cover from predators. Therefore both are good at moving quickly over long distances. Neither one of them belongs in the Mesozoic Era on a timeline of life. Mesozoic mammals were much smaller and less specialized.
Does your timeline have the five major extinctions? And does it have ice ages in the right places? The older charts used ice to symbolize all extinctions, although that wasn’t the cause in most of them. The five major extinctions come at the end of the Ordovician, Devonian, Permian, Triassic, and Cretaceous Periods. They are such important shapers of life that they are essential to a good timeline.
If all this correcting sounds like too much to do, remember that you are doing it for the children. They need current information and a foundation that they can use in their future studies. There is no point in giving them science “information” that they will never see outside a Montessori classroom.
What impressions of plants are we giving? Part 3. Stems and leaves August 12 2019, 0 Comments
When we use the botany impressionistic charts to introduce children to plants, are we giving them correct information and the important ideas for them to know? That is the question I’ve been asking in this series. I’d like to call the charts “An overview of how plants work” or perhaps “Imagine how plants work." In English, the term “impressionistic” can imply that the material is hazy and unclear.
Several of these charts show people doing things to illustrate what the plant accomplishes. For instance, little men are shown anchoring roots like tent stakes. While some of this may help children understand plants, I find the real plant characteristics and real plant structures wonderful and inspiring as they are.
What do the traditional charts say about stems? One chart says that some stems are weak, and so they have to grow some structure to help them climb to reach the sunlight. This one has always driven me nuts. Nature doesn’t make weak organisms; natural selection acts against the poorly adapted. There is a better way to look at stems that climb. They have adaptations that allow them to grow upwards but don’t require them to develop a thick, rigid stem. Some kinds of vines have flexible woody stems. They are called lianas and they include grape vines and cat’s brier (Smilax). Lianas are common in tropical forests, and their stems certainly shouldn’t be called weak, as the photo shows.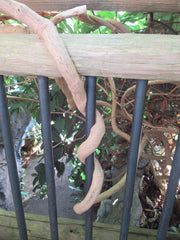
The chart on stems that climb could also show children that plants do many things with their stems beyond the usual connecting roots and leaves. Stem adaptations include food storage (kohlrabi, potato) and water storage (cacti, other succulents). Two quite different looking specialized stems help grow new plants. Corms are short, thick stems that store food and propagate the plant (gladiolus, banana). Without corms, we wouldn’t have bananas to eat because the domestic bananas are seedless. Runners are greatly elongated stems that enable the plant spread its offspring across the ground (strawberries). Thorns are short, pointed stems that discourage herbivores (hawthorn). Climbing roots, twining petioles, twining stems, and tendrils represent many ways that plants can fulfill their need to reach the sunlight.
The traditional botany charts include a depiction of photosynthesis in the leaf. Please make sure that you are giving children accurate ideas about photosynthesis. Hint: If your “chemical factory in the leaf” chart shows carbon monoxide being formed, it is giving false information. Why should we ask children to imagine false ideas when we can give them steps in the real process? The process of photosynthesis has quite a lot of details, and it must be greatly simplified for children, but if we are going to give them an idea of what goes on, it should be a valid framework to which they can add details later.
The “chemical factory in the leaf” should show that sunlight is used to break apart water molecules. It is the chlorophyll molecules that capture the Sun’s energy. The sunshine-requiring “light reactions” produce hydrogen ions and oxygen molecules. (They also produce high energy electrons and energy-rich molecules (ATP), but that is more chemistry than beginners need.) The hydrogen is joined to a carrier molecule, moved to a different area, and combined with small, carbon-containing molecules that have had a carbon dioxide attached. A series of reactions produces sugar. Most charts simply show the hydrogen and carbon dioxide entering a structure of some sort and sugar coming out. That is likely to be enough information for the beginner.
Check the depiction of carbon dioxide on your charts. It is a linear molecule. There is a carbon in the center with an oxygen on either side. The oxygens are directly opposite one another – 180 degrees apart. It isn’t like water, which is v-shaped.
I’ve seen charts that show the sugars from photosynthesis being combined into starch, which does happen in plants. A little bit of starch is made in the chloroplast, and it acts as fuel during the nighttime. Starch, however, is NOT transported through the plant’s phloem. Starch is too big to go into solution. The transportable product of photosynthesis is the sugar sucrose (table sugar). The sucrose travels to leaves, stems, and roots, where it is converted to starch, which stores the chemical energy until it is needed. Sucrose is made from two 6-carbon sugars, so there is some processing of the product of photosynthesis before it is transported.
And then there is the chart that shows leaves worshiping the Sun. Do we worship the food on our plates? No, although a healthy serving of appreciation for the food that sustains us is a good thing. The real leaf story is so much more interesting. We can help children imagine how a plant positions its leaves and appreciate beautiful leaf arrangements. As for the leaves, they are arranging themselves to get maximum sun but minimum damage. Sunlight comes with heat, and leaves take action to avoid getting cooked. A leaf in the shade may be oriented horizontally. In full sunlight, the same species may turn its leaves on edge to protect them from heat. In deserts, many plants orient their leaves to catch less of the Sun’s hot rays.
I’ve always found much in nature that is inspiring and remarkable, and that’s without turning plants into people. When we learn about a natural phenomenon, there always seems to be more of the story. This alone can be inspiring to children. We can let them know that there is much more to the story of plants and how they work than we show on the botany charts.